


Diagnosing Latency Issues
Custom reporting in Kong Konnect gives you the power to monitor your API data in detail and export that data to a CSV file. Let’s go through an example situation where you could leverage custom reports.
Build reports
You can build custom reports by navigating to ![]() Analytics in the Konnect menu, then Reports. This brings you to a list of all custom reports in the organization. From here, click New Report to get started.
Analytics in the Konnect menu, then Reports. This brings you to a list of all custom reports in the organization. From here, click New Report to get started.
- Name: Production - Kong vs Upstream Latency (last hour)
- Chart type: Line chart
- Date/Time: Last One Hour
- Metrics: Kong Latency (avg), Upstream Latency (avg)
- Choose Granularity: Minutely
You can select more than one metric by clicking on Select Multiple next to the Metrics dropdown list.
Then, they add a filter to filter by the control plane
- Filter by: Control Plane
- Operator: In
- Value: prod
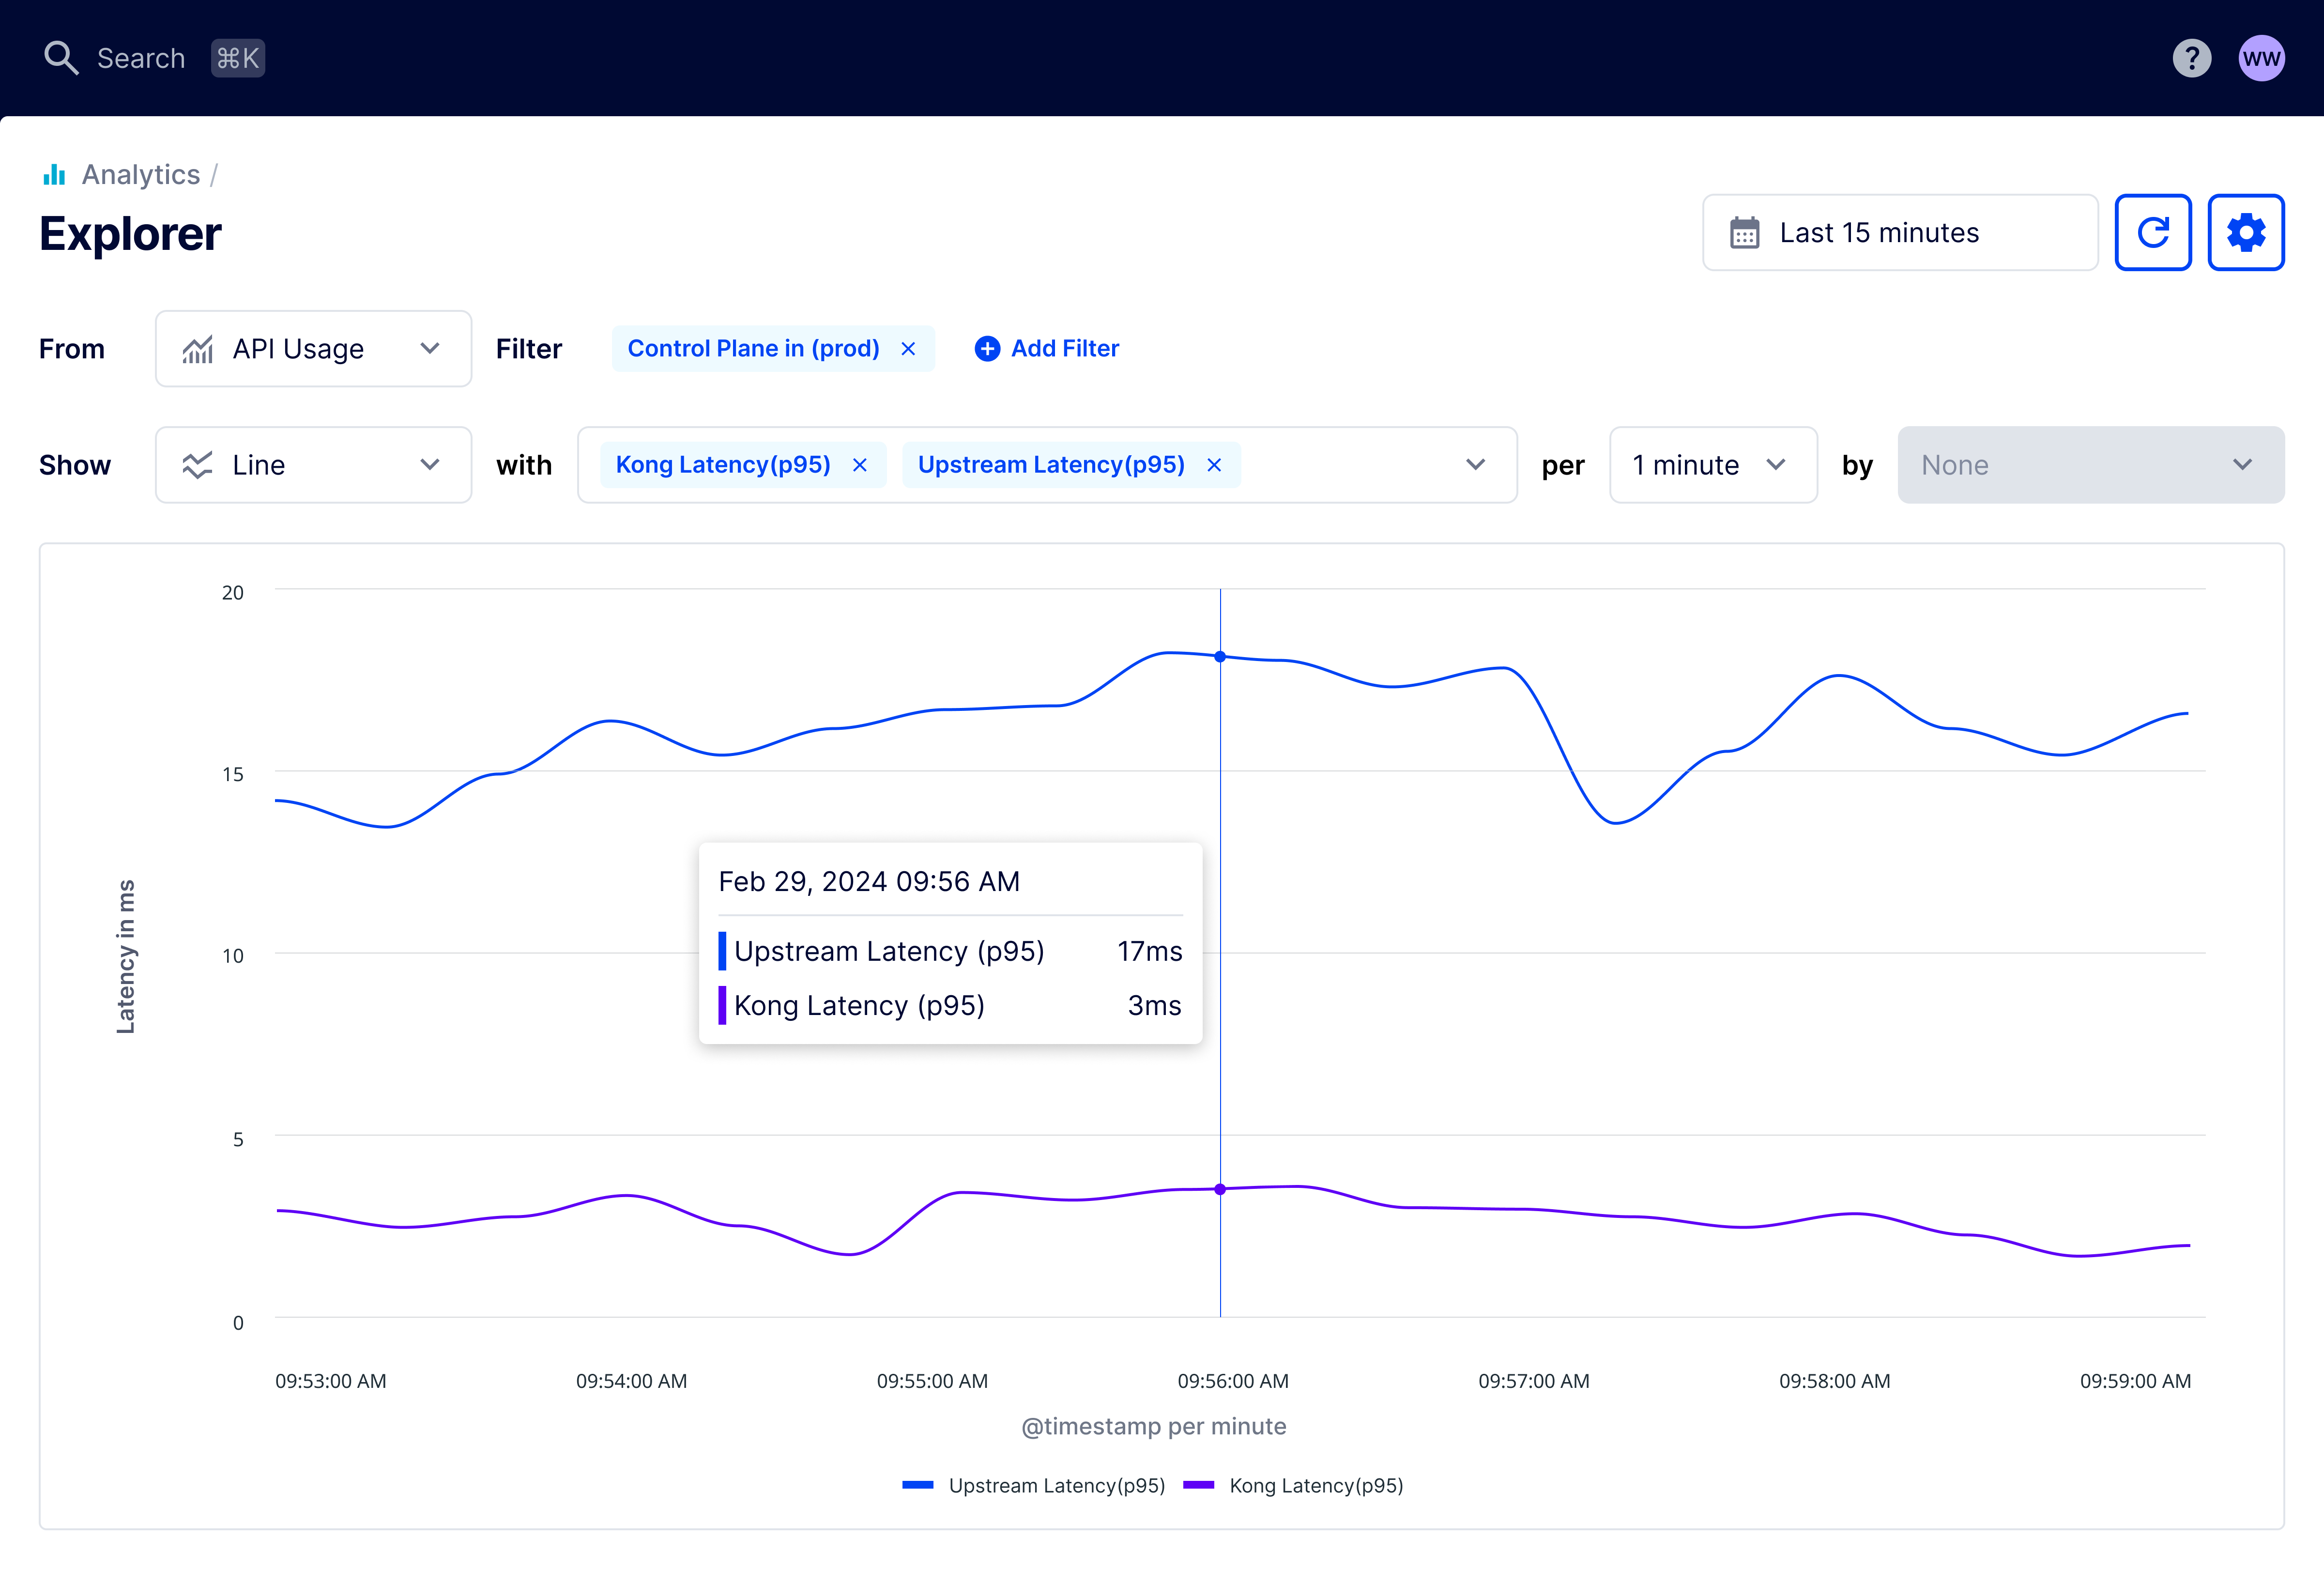
Figure 1: Line chart showing average upstream and Kong latency over the last hour. .
Conclusion
With this type of report, you can start exploring which upstream service might cause the latency spike.