PermalinkKong Manager
Kong Manager is the graphical user interface (GUI) for Kong Gateway. It uses the Kong Admin API under the hood to administer and control Kong Gateway. It comes in two options, depending on the edition of Kong Gateway that you’re running: open-source or enterprise.
Here’s a comparison of some of the capabilities you get access to between the Kong Manager Enterprise (or Free mode) edition, and the OSS edition:
| Capability | Kong Manager Enterprise | Kong Manager OSS |
|---|---|---|
| Manage all workspaces in one place | ✅ | ❌ |
| Create and manage routes and services | ✅ | ✅ |
| Activate or deactivate plugins | ✅ | ✅ |
| Manage certificates | ✅ | ✅ |
| Group your services, plugins, consumers, and everything else exactly how you want them | ✅ | ❌ |
| Manage teams | ✅ | ❌ |
| Manage users and roles for both Kong Gateway and for the Dev Portal | ✅ | ❌ |
| Configure Dev Portals: customize appearance, manage developers and applications, and edit Dev Portal layouts, specs, and documentation | ✅ | ❌ |
| Monitor performance: visualize cluster-wide, workspace-level, or even object-level health using intuitive, customizable dashboards | ✅ | ❌ |
| Manage vaults | ✅ | ✅ |
Note: If you are running Kong in traditional mode, increased traffic could lead to potential performance issues for the Kong proxy. Server-side sorting and filtering large quantities of entities can also cause increased CPU usage in both Kong Gateway and its database.
To access Kong Manager, go to the following URL after installing Kong Gateway (OSS): http://localhost:8002
PermalinkKong Manager interface
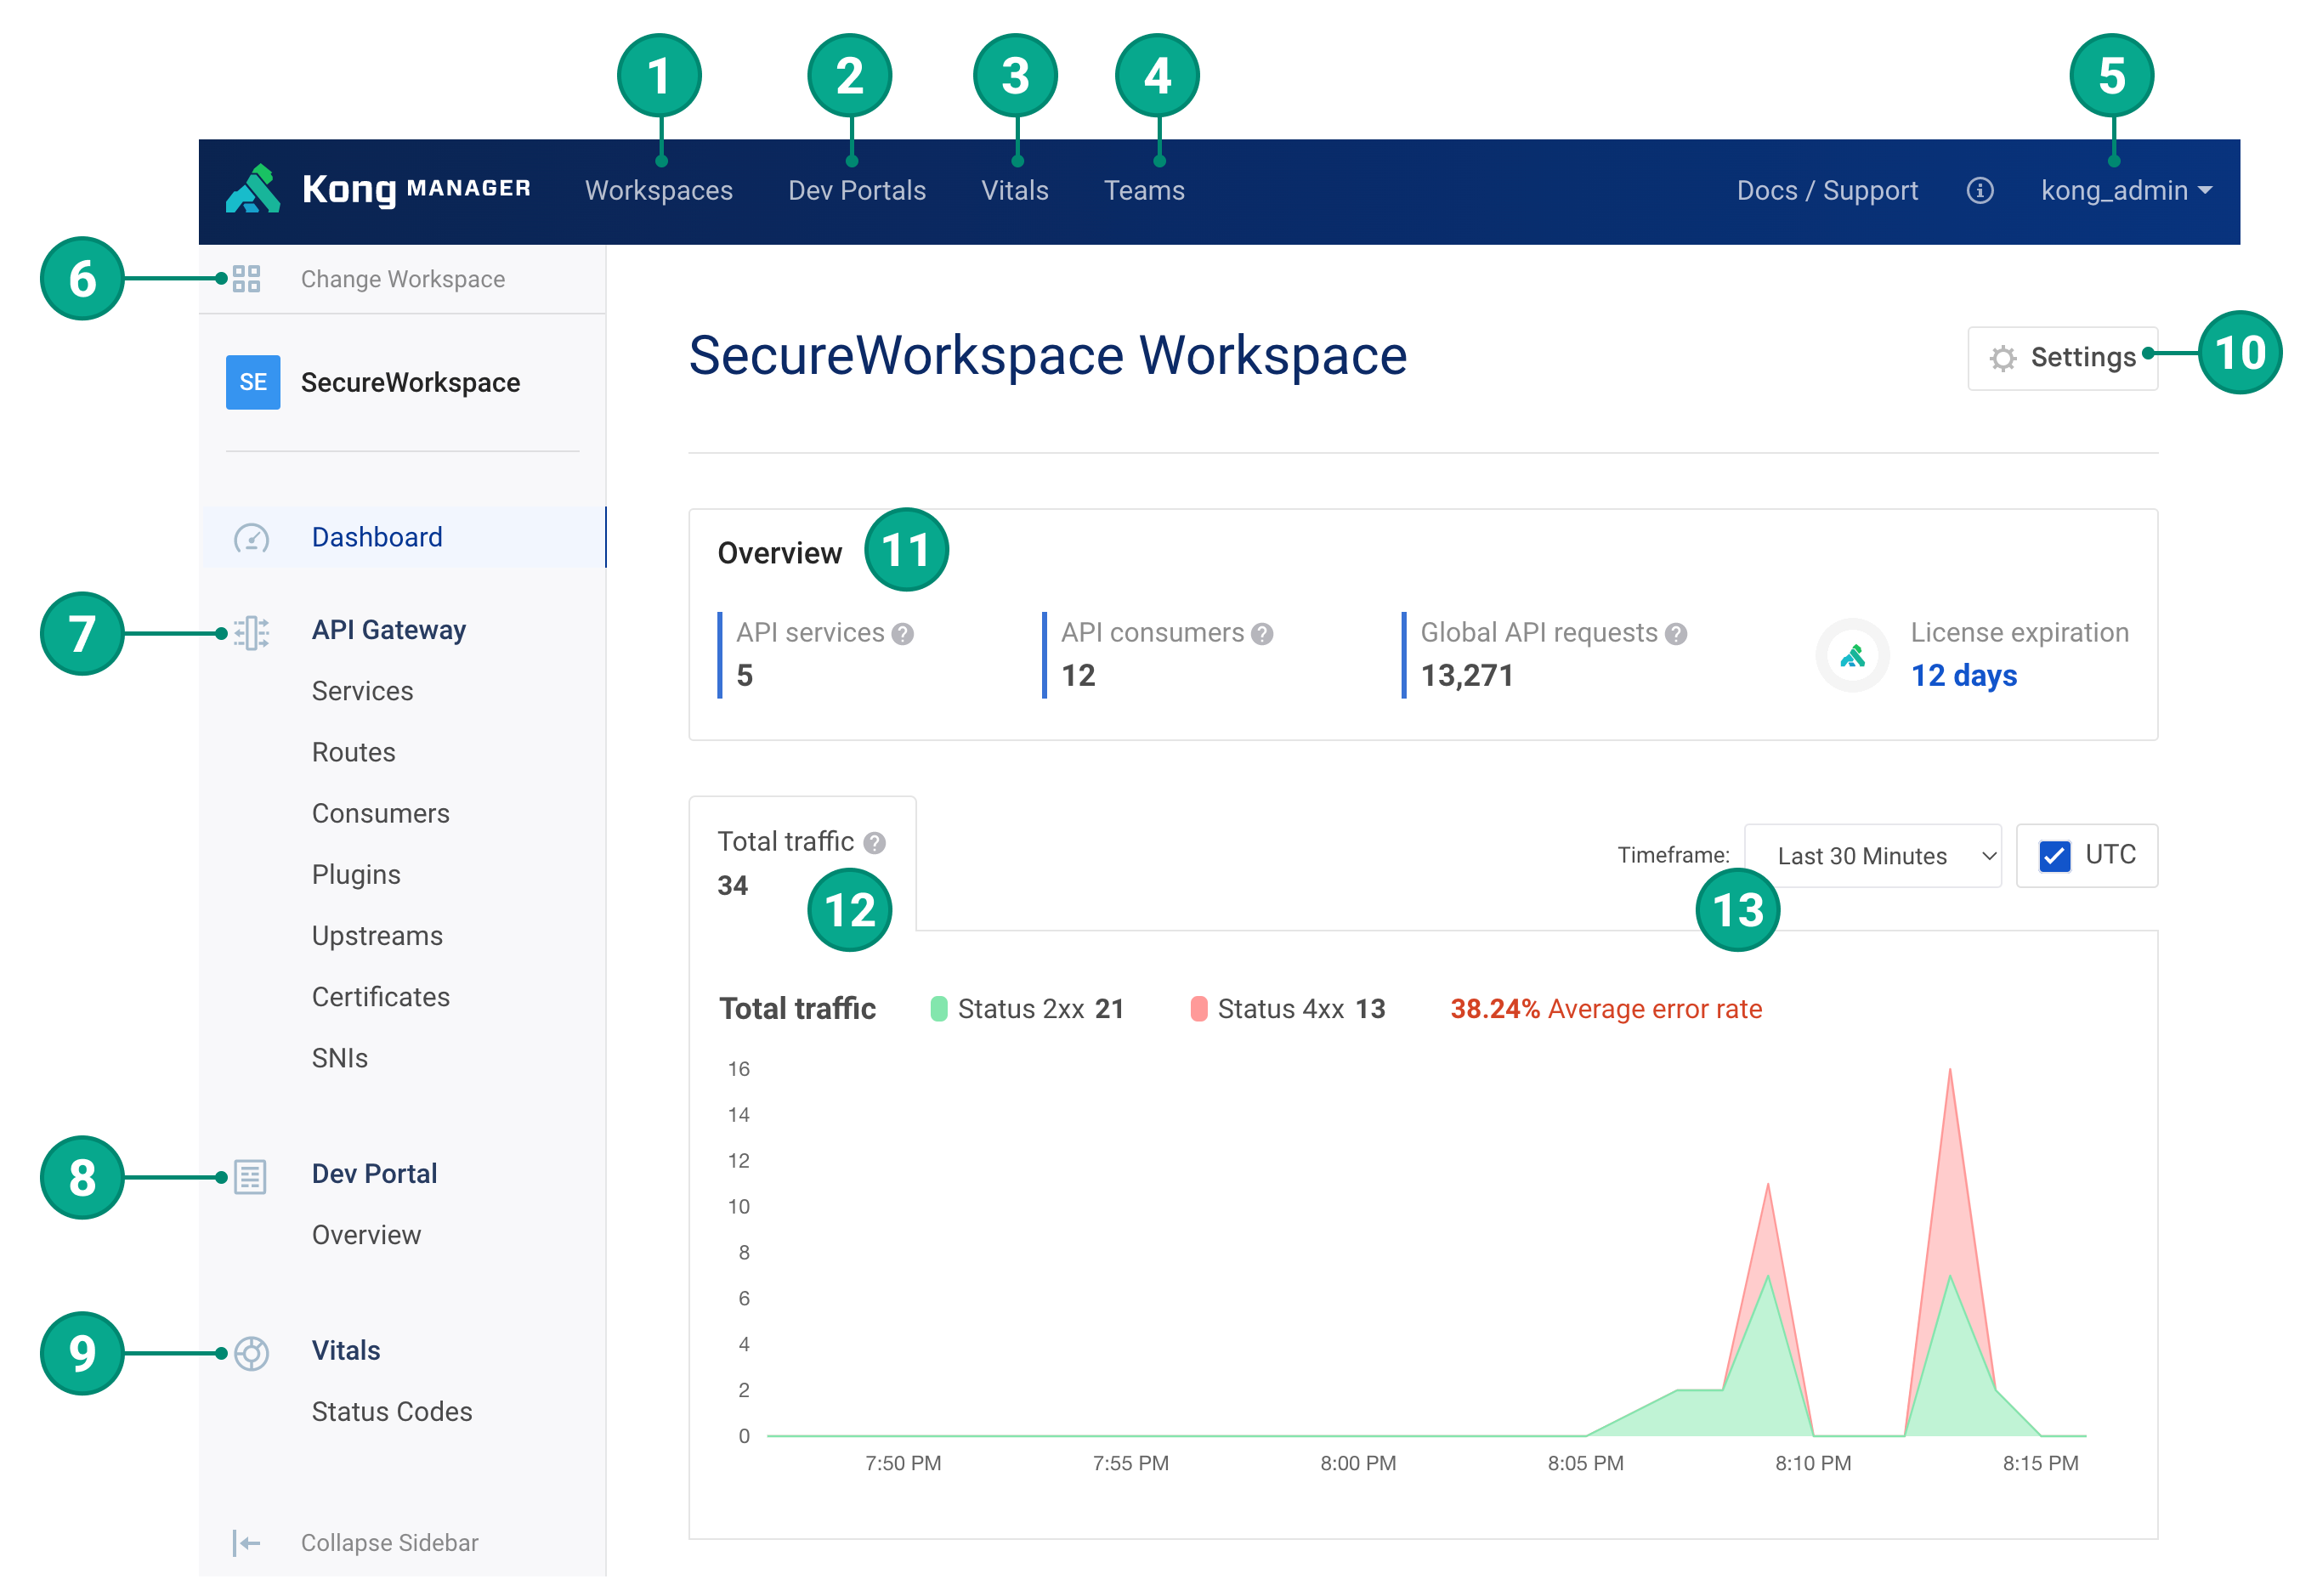
Figure 1: Kong Manager individual workspace dashboard
PermalinkTop menu
PermalinkSide menu
| Number | Item | Description |
|---|---|---|
| 6 | Change workspace | Shortcut to quickly change between workspaces. |
| 7 | API Gateway | Manage the Kong Gateway entities in the current workspace. |
| 8 | Dev Portal | Workspace-specific Dev Portal configuration. If you enable Dev Portal for the current workspace, the menu will have additional items: • Settings: General settings for the Dev Portal instance in this workspace • Appearance: Customize your Dev Portal colors, fonts, and branding • Developers: Manage developer requests and access • Applications: Manage application requests and access • Permissions: Manage roles and content permissions • Editor: Access the Dev Portal files editor to configure layouts, documentation, and specs |
| 9 | Vitals | Monitor requests by access code for all services in the workspace. |
PermalinkWorkspace dashboard
| Number | Item | Description |
|---|---|---|
| 10 | Settings | Edit the workspace avatar or delete the workspace. |
| 11 | Overview panel | Overview of key statistics for the workspace: number of services, consumers, and API requests, as well as the license validity information. |
| 12 | Total traffic graph | Total traffic in the workspace by status code within a selected time frame. |
| 13 | Time frame selector | Choose the time frame for the traffic graph, from the last 5 minutes to the last 12 hours. |
PermalinkKong Manager OSS interface
Kong Manager Open Source (OSS) is the graphical user interface (GUI) for Kong Gateway (OSS). It uses the Kong Admin API under the hood to administer and control Kong Gateway (OSS).
Note: Kong Manager OSS is designed for use with the Open Source version of Kong Gateway (OSS).
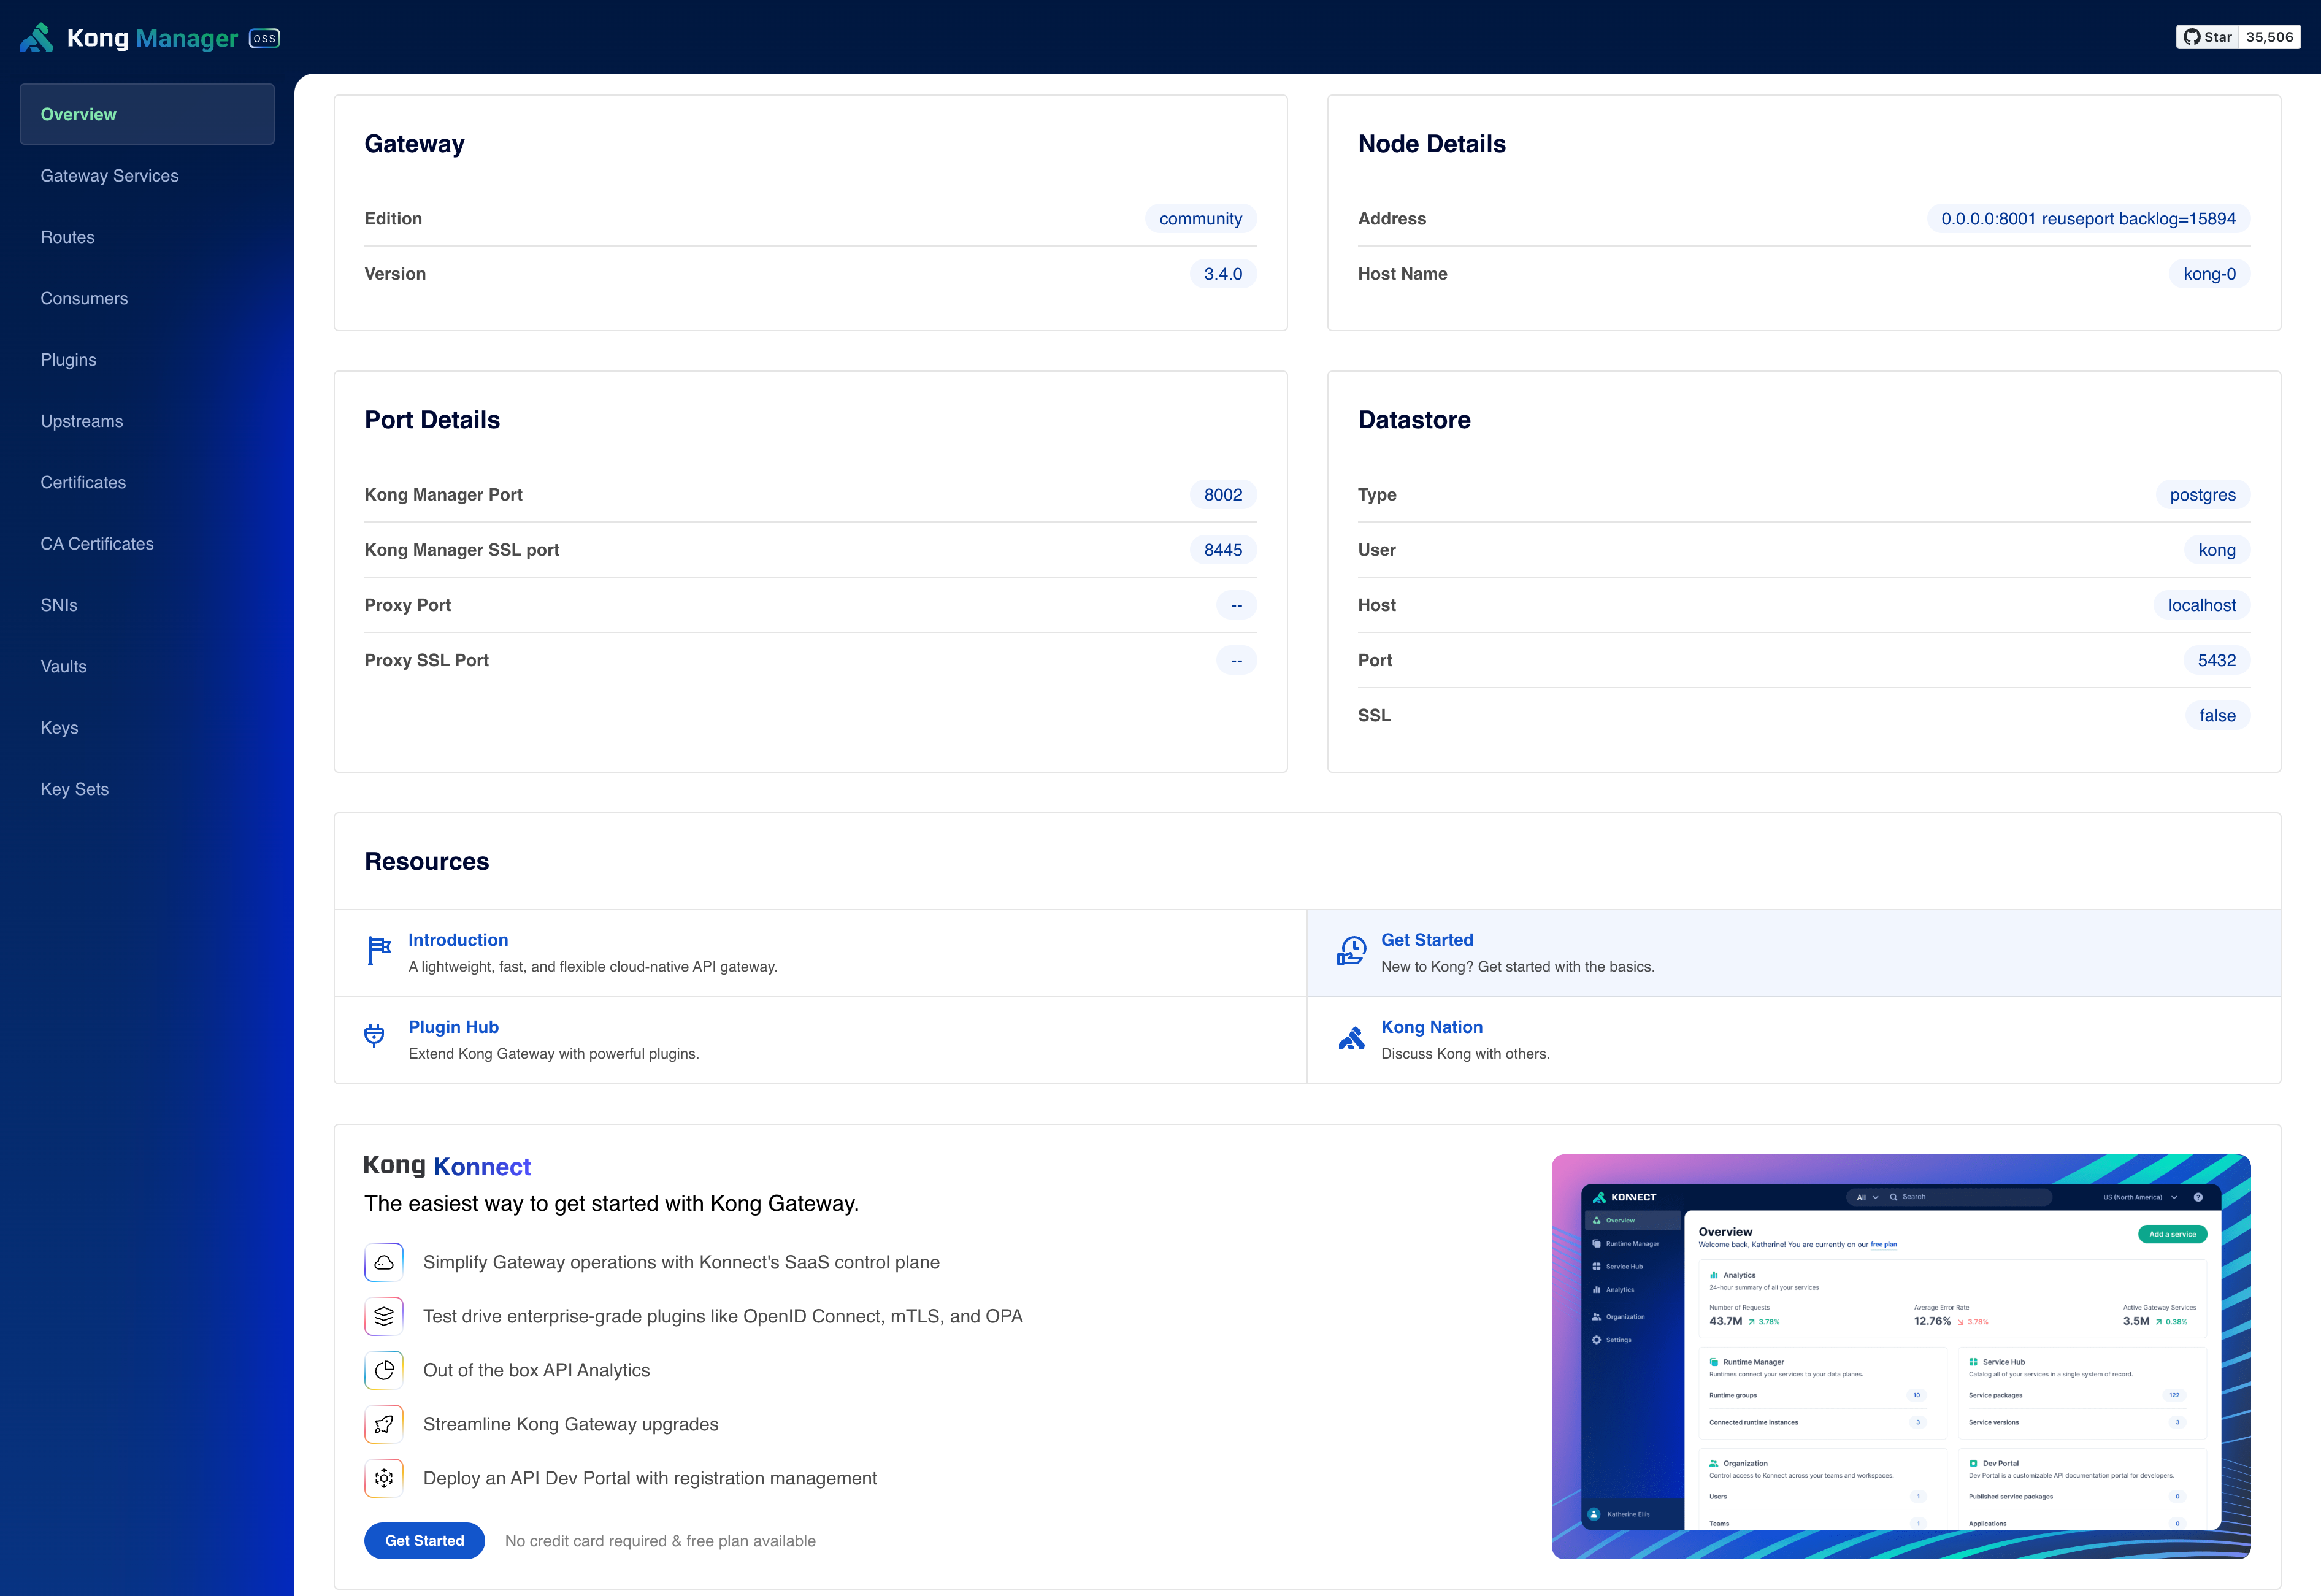
Figure 2: Kong Manager OSS overview
| Item | Description |
|---|---|
| Overview | Dashboard that contains information about your Kong Gateway (OSS). |
| Gateway Services | Overview of all services associated with your Kong Gateway (OSS). From this dashboard, you can add new services, manage existing services, and see all services at a glance. |
| Routes | Overview of all routes associated with your Kong Gateway (OSS). From this dashboard, you can add new routes, manage existing routes, and see all routes at a glance. |
| Consumers | Overview of all consumers associated with your Kong Gateway (OSS). From this dashboard, you can add new consumers, manage existing consumers, and see all consumers at a glance. |
| Plugins | Overview of all plugins associated with your Kong Gateway (OSS). From this dashboard, you can enable or disable plugins. |
| Upstreams | Overview of all upstreams associated with your Kong Gateway (OSS). From this dashboard, you can add new upstreams, manage existing upstreams, and see all upstreams at a glance. |
| Certificates | Manage your certificates for SSL/TLS termination for encrypted requests. |
| CA Certificates | Manage your CA certificates for client and server certificate validation. |
| SNIs | Manage SNI object one-to-many mappings of hostnames to a certificate. |
| Vaults | Manage the security of Kong Gateway (OSS) with centralized secrets. |
| Keys | Manage your asymmetric keys by adding a key object. |
| Key Sets | Manage your asymmetric key collections by adding a key set object. |